


Zena.food: I Used Machine Learning to Find Genoa’s Hidden Restaurant Gems
There is an article by Lauren Leek called How Google Maps quietly allocates survival across London’s restaurants. I read it eight months after moving to Genoa and could not put it down. The premise is precise and a little uncomfortable: the way Google Maps ranks restaurants has almost nothing to do with food quality. It is about algorithmic prominence, a composite of review count, review velocity, web presence, and interaction signals. Venues that accumulate more reviews rank higher. Higher rank brings more visitors. More visitors bring more reviews. The loop does not care whether the food is good.
I finished reading and the thought was immediate. I live in Genoa, I should do this for Genoa. Not because I had been struggling to find good restaurants, and not because anyone had suggested it. Just because I was still exploring a city I had moved to eight months ago, and this was an interesting way to understand it better. The city would be the dataset. The question was whether the data would confirm what I had started to suspect from walking around.
The result is zena.food, an interactive map of Genoa’s restaurant landscape that strips out structural bias and surfaces the places the algorithm is systematically underrating. And the other direction too.
![]()
What Genoa actually is
Genoa is not what people picture when they think of Italy. It is not Florence. It is not Rome, thank God. It is a working port city stacked vertically against a hillside in a way that makes no obvious geographical sense, with a medieval alley network, the Caruggi, that tourists find intimidating and residents navigate on muscle memory. The UNESCO-listed old town alleys are narrow enough that two people with shopping bags cannot pass without one of them sidewalk-dancing. GPS signals bounce off six-story medieval buildings and route you into dead ends with the confidence of someone who has never been here. This is not a complaint. It is the city’s personality.
The tourism that Genoa gets is almost entirely cruise-ship footfall. Ships arrive at Porto Antico. Passengers have four to six hours. They walk to the Acquario, which is the largest aquarium in Italy and genuinely deserves its reputation, eat somewhere within walking distance of the terminal, and return to the ship. They leave reviews. The reviews describe the experience of being a tourist in Genoa for an afternoon. They have almost nothing to do with the city that residents actually live in. This creates a predictable effect: the waterfront and tourist-adjacent zones accumulate reviews at a volume that has nothing to do with food quality and everything to do with foot traffic. A restaurant in an elevated zone of the city, accessible by funicular and frequented almost entirely by people who actually live here, might have a tenth of the reviews of a waterfront venue. The ratings look comparable on the map. They are measuring completely different things.
The old alley network makes this worse. Small trattorias there have sometimes operated for three generations without a website, without an Instagram account, without a Google Business profile that anyone actively manages. They accumulate reviews the way genuinely good things accumulate recognition: slowly, from people who were actually looking. The algorithm reads this as low confidence. It is low exposure, which is a different thing entirely. Google Maps treats both as restaurants with ratings. The structural context is invisible to the algorithm, and that invisibility is not neutral.
The Tourist Index
Zena.food is built for people who live in Genoa, not for people passing through on a ship. The thing I find genuinely obnoxious about tourist trap restaurants is not that they exist. It is that the algorithm actively promotes them at the expense of everything else, because the signals the algorithm uses to measure quality are the same signals that tourist-heavy venues accumulate as a structural side effect of location. Fixing that required measuring it first.
The Tourist Index (TI) is a composite score from 0.0 to 1.0 measuring how much of a venue’s rating is likely explained by tourist footfall rather than local quality. Three pillars.
S_i, spatial proximity (weight 40%). Distance decay from five tourist poles: the Acquario, Piazza De Ferrari, Via Garibaldi, Stazione Principe, and Boccadasse. Formula: max(0, 1 - d_min / 500). At 50 meters from the Acquario, S_i is around 0.90. Venues in elevated zones of the city score close to 0. The five poles were chosen by looking at a map of Genoa and asking where cruise tourists actually go. The answer was not complicated.
V_i, semantic vocabulary (weight 40%). Gemini 2.5 Flash reads the review text for each venue and scores how tourist-oriented the language is. Tourist markers: “right next to the aquarium”, mixed-language reviews, cruise ship references, “perfect for a quick stop before boarding.” Local markers: dialect terms, references to specific Genoese dishes by their actual names (pansoti col tocco, trofie al pesto, farinata, cima alla genovese), the vocabulary Italians use when writing for other Italians rather than for anyone who might be reading. A 4.5 from someone who writes “amazing focaccia!!!! 😍😍” and a 4.5 from someone who writes “posto buonissimo, prezzi onesti” and nothing else carry different information. This pillar tries to encode that difference.
E_i, topographic accessibility (weight 20%). Elevation from OpenTopoData at 30m SRTM resolution, with a +46m geoid correction specific to Liguria, because satellite elevation data has a systematic offset in this region that was putting several Genoese restaurants technically underwater without it. Normalized so sea level scores 1.0 and 50 meters above scores 0.0. Below 50 meters, a tourist can walk from the waterfront. Above it, they need to know where they are going.
The composite: TI = 0.40·S_i + 0.40·V_i + 0.20·E_i
One pillar got cut. The initial design included the linguistic ratio of reviews: the proportion of Italian-language reviews versus other languages. It seemed like a clean tourist signal. The problem is that Google Places API returns only five algorithmically-selected reviews per venue, and that selection is biased toward high-engagement content, which correlates with tourists, which means for tourist-heavy venues the API was already filtering toward English-language reviews before I ever saw them. Using that as a tourist signal was circular. It would have measured the API’s own bias, not the restaurant’s actual visitor composition. It got removed.
Hidden Gems
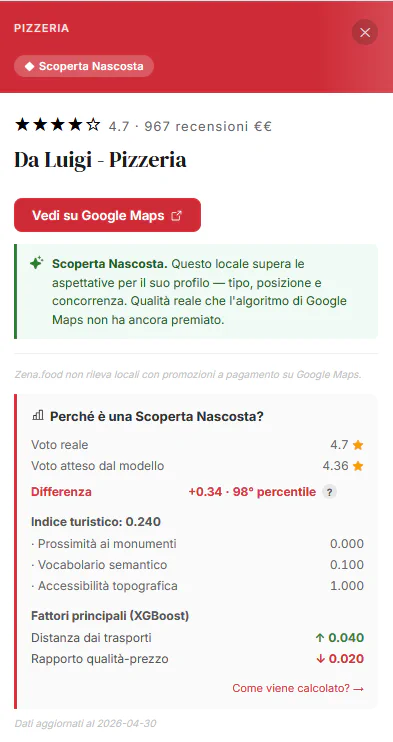
The Tourist Index tells the model how much structural tourist exposure a venue has. The model uses that, plus everything else it knows about the venue, to predict what rating that venue should have. A Hidden Gem is what happens when the prediction is wrong in a specific direction: the venue is doing meaningfully better than everything working against it would suggest.
Think about what that means concretely. A trattoria deep in the alley network has a low tourist index, few reviews, no web presence, and sits in a zone where the algorithmic ceiling is low. The model looks at all of that and predicts a modest rating. If the actual rating is substantially higher, the gap is the residual. Venues in the top 15% of residuals are Hidden Gems. The structural disadvantage was real. The venue exceeded it anyway. That gap is the cleanest proxy for quality this dataset can produce.
On the map, gems glow. The animated ring around a marker is the visual signal that something is there worth investigating. Clicking it opens the venue card with the Tourist Index breakdown per pillar and a SHAP explanation in plain language: which factors most influenced the model’s prediction and in which direction. “High elevation contributed positively to the gem classification” means the model expected a lower rating because of the location’s reduced visibility, and the venue outperformed that expectation. It is not a guarantee of a great meal. It is a well-reasoned suggestion.
There is a secondary category worth mentioning: slow accumulators. These are venues with a high rating relative to their review count for their cuisine peer group. They have fewer reviews than similar places in similar zones, but their rating holds up or exceeds what would be expected at that review volume. The model does not know why they have few reviews. It just notices they are outperforming their structural weight. These are often newer places, or places that locals have found quietly without the review machinery catching up. The flag exists because a gem with 300 reviews means something different from a gem with 18 reviews and a 4.6. Both are interesting. The second is rarer.
The model
The Tourist Index describes structural exposure. The model predicts the structural baseline rating: given everything knowable about a venue’s location, prominence, cuisine, and exposure, what rating would the algorithm expect?
XGBoost regression, trained on 935 Genoese venues with at least 30 reviews and currently operational. The feature matrix includes log review count (not raw count, because the distribution is heavily right-skewed and a handful of waterfront venues have five-digit review totals), price level, H3 hexagonal cell density, elevation, an old town flag, distance to the nearest public transport node, the Tourist Index, Gemini-classified cuisine category, a chain flag, cuisine diversity per zone, and a zone type derived from PCA clustering of H3 aggregates. That clustering groups areas by composite character: average rating, total review volume, chain concentration, cuisine diversity, producing four types. A gem in an everyday residential zone is a stronger signal than the same residual in a tourist-heavy waterfront zone, because the structural ceiling is lower in the first case.
Optuna ran 100 trials to tune hyperparameters. Cross-validation RMSE across 5 folds, stratified by H3 zone: 0.2809. The target was 0.25. Google ratings in Genoa cluster tightly between 3.8 and 4.8 for most operational venues. Nobody who gives a restaurant a 2.0 was on a cruise ship having a pleasant afternoon. The distribution is compressed by design, which is why a residual standard deviation of 0.28 on a 5-point scale is workable even though it missed the target. Not where the plan said it would land, but close enough to be useful.
The output is a residual per venue: actual rating minus predicted. Top 15% of residuals are gems. Bottom 15% are traps. Chains are excluded from gem classification regardless of residual, because brand recognition inflates review velocity in ways unrelated to food quality. The 20 chains detected in Genoa were unsurprising.
Final count: 1,578 venues. 141 gems, 140 traps. 143 flagged as slow accumulators. The full dataset covers restaurants, bars, and cafés across the city.
On playing nice with Google
One thing I spent a disproportionate amount of time on was making sure this project does not create problems with Google. That sentence sounds defensive. It is not. It is just accurate. Building a product on top of an API requires reading the Terms of Service, understanding what they actually say, and structuring the technical implementation to comply with them. I did all three, partly because I prefer it that way and partly because a cease-and-desist letter from Google would end the project faster than a bad RMSE.
The data comes from the Google Places API (New), a public, documented, and explicitly authorized interface. The project does not scrape Google Maps. It does not crawl pages. Every request goes through the official API with a valid key, with field masks to request only what is needed, with cost tracking to stay within budget. The Google Maps Platform Terms of Service require that cached data be refreshed within 30 days. The pipeline runs quarterly and handles this. The raw data from the API, including review text, is deleted after processing. What Zena.food stores permanently is only the derived output: the predicted rating, the residual, the gem label, the SHAP explanation. These are the model’s own computations, not Google’s content. The only piece of raw API data stored indefinitely is the place_id, the unique identifier Google explicitly permits to be archived permanently, and the only thing needed to link back to a venue’s official Google Maps page, which every venue card does.
The frontend displays “Powered by Google” attribution. It links to Google Maps for all venue-level detail. The project does not host review content. It does not compete with Google Maps. It points at it. The full legal and privacy documentation is at zena.food/legale for anyone who wants the specifics.
As for the financial side: Gemini 2.5 Flash through AI Studio is free at 1,500 requests per day, and one full Genoa pipeline run fits within that limit. The elevation and transport data are public domain and ODbL respectively. The Google Places API is none of those things. The amount I spent on it is between me, Google Cloud, and a billing dashboard I have decided to stop opening. There is a reason the pipeline runs quarterly.
The stack
The full pipeline runs on Python, which requires no justification for anything involving spatial joins, Parquet files, and gradient boosting. Spatial indexing uses Uber’s H3 hexagonal grid, which tiles space more evenly than squares and gives consistent density calculations whether you are in a dense alley block or a sparse hillside terrace where three trattorias share what used to be someone’s garden.
Gemini 2.5 Flash handles cuisine classification and the semantic scoring of reviews. The choice was partly the free tier and mostly the structured JSON output with Pydantic validation. A pipeline that fails silently when an LLM returns creative prose instead of a valid schema is a pipeline you will distrust forever. Pydantic makes failures loud.
Go is my primary language. FastAPI with Pydantic v2 is the closest Python gets to Go’s type discipline: explicit schemas, fast validation, predictable behavior. The API loads the scored Parquet file at startup with an LRU cache and filters on request. There is no database at query time because there does not need to be. The final dataset is one file. The pipeline produces it, the API serves it, and that is the whole architecture.
The frontend is React with deck.gl for map rendering. At 1,500 venues with animated glow rings for gems, Leaflet degrades. deck.gl runs on WebGL and does not. MapLibre provides the base tile layer without a Google Maps JavaScript license. Zustand handles filter state. TanStack Query handles data fetching. There is no Redux because there is no problem here that Redux solves and Zustand does not solve in a tenth of the lines.
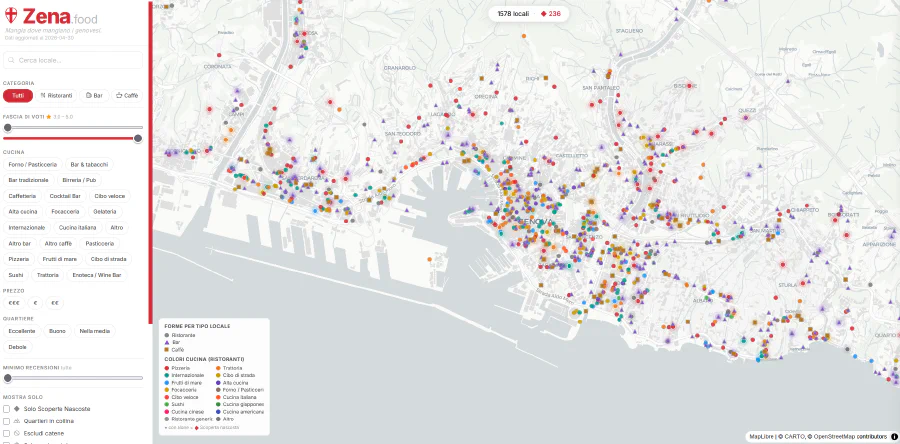
What came out
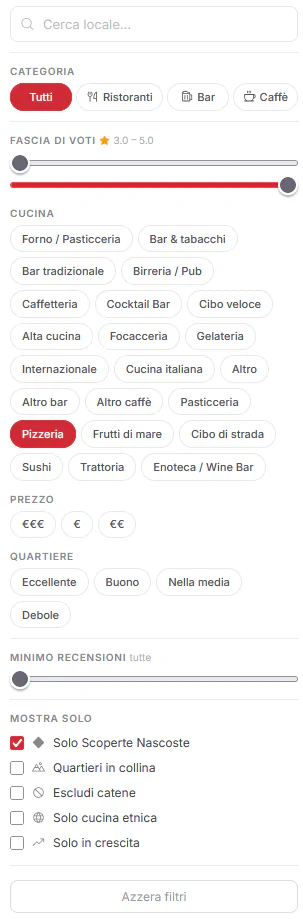
The site is live at zena.food. The map shows all 1,578 venues, filterable by cuisine, price, zone, elevation, and gem status. Clicking a venue opens a panel with the Tourist Index breakdown per pillar, a SHAP explanation of what drove the model’s prediction, and a link to the venue on Google Maps.
The gems cluster in two places: the old alley network and the elevated zones of the city. The traps cluster in the tourist waterfront. Neither is surprising in retrospect. The more interesting finding is about ethnic minority cuisines. Venues classified as Street Food and International by Gemini appear in the gem tier at a rate higher than their share of the total dataset. Ethnic minority cuisines represent about 22% of all venues. Their gem rate is noticeably higher. Lauren Leek found the same pattern in London. The partial explanation is location: these venues tend to cluster in zones with low tourist exposure, giving them lower structural baselines that are easier to exceed. But after controlling for location and prominence, there is still signal left. What it represents is a genuine open question, and one I find more interesting than the map itself.
The slow accumulator flag produced the most satisfying validation. Several of the 143 venues flagged as rising were places locals had already told me about. The model found them independently, using only review count relative to cuisine peers and current rating. It has no idea why those venues have few reviews. It just noticed they are outperforming their structural weight.
Zena.food turned out to be an excellent weekend project, in the sense that it took considerably more than a weekend and I am very glad I built it anyway. It is the best restaurant, bar, and café guide I have found for Genoa, which is a low bar to clear given that the competition is Google Maps with its known biases. But the bar was cleared, and my wife, who has strong opinions about romantic dinners and a healthy distrust of tourist traps, is now genuinely happy to let the app suggest our next one.