Author’s note: this is the second half of a story. The first part ends at 01:59 with the game finally running and me looking at it for one minute before turning the machine off. This one is about what happened when I actually tried to play it.
The next window came sooner than I expected: a whole Saturday. For a recent father that is a small miracle and I will not explain how it happened, only that I intended to use every minute of it on Crimson Desert, which after last night’s surgery was finally launching.
It launched. It ran. It ran at 30 frames per second in the first city, on a laptop that every benchmark on the internet said should do 60. And the fans sounded like a plane taxiing in my living room.
I’ll be honest, my first thought was “that’s Proton, that’s the price of Linux, live with it”. My second thought was that I had a whole day and a notebook to fill. So here is the notebook: three separate problems stacked on top of each other, a handful of wrong turns, and a laptop that at the end of the afternoon holds 60 frames in the city and sounds like a laptop.

Same rules as part one. Same machine (Arch, Omarchy, Hyprland, an ASUS TUF A15 with a Ryzen 7 7435HS, an RTX 4060 laptop card with 8 GB of VRAM and 16 GB of RAM). Every concept gets one sentence of explanation when it first shows up, because I had to look half of them up myself. The recipe is at the end.
The frame rate that ignored everything
The game is on GE-Proton10-34 with the transplanted vkd3d-proton from part one. The graphics preset is High, DLSS on Quality. DLSS, if you have never met it, is NVIDIA’s trick of rendering the game at a lower resolution and using a neural network to scale it back up, which costs a little sharpness and gives back a lot of frames. I had MangoHud on screen, the little overlay that shows fps, frame time and how busy the CPU and GPU are.
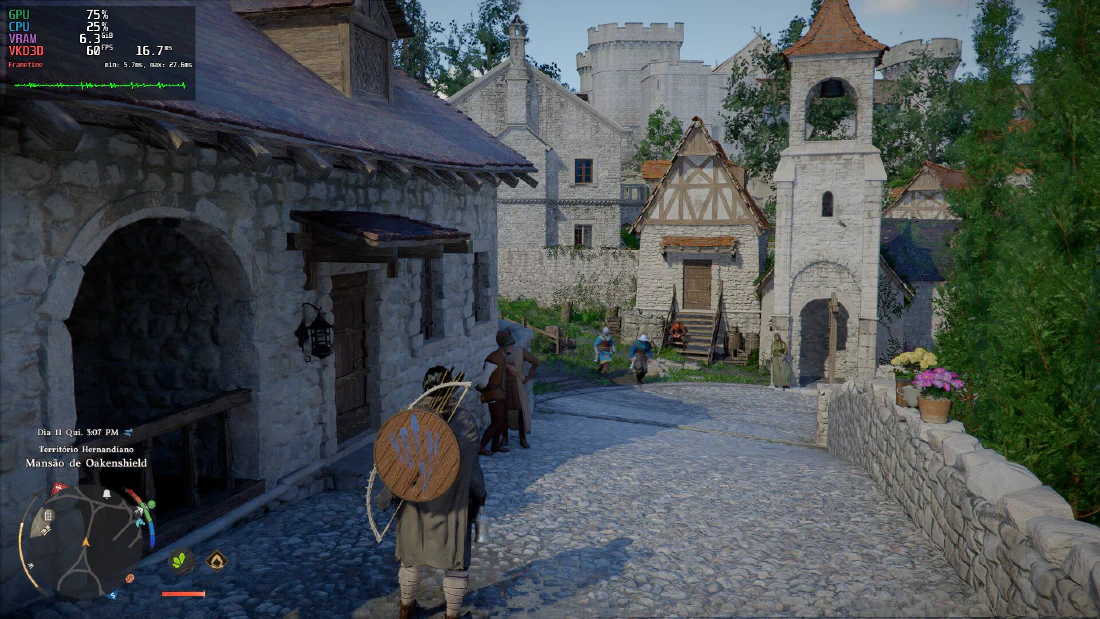
The market street of the first city: 30 to 35 fps. GPU at 80%. CPU at 40%.
That combination is the interesting part, and it is the reason this post exists. When a game is slow, one of two chips is usually the bottleneck. If the GPU is at 99%, the graphics card is the limit and you lower graphics settings. If one CPU core is at 100%, the processor is the limit and no graphics setting will help you. Here neither was saturated, and when I dropped the preset to Medium and DLSS to Balanced, the game went from 35 to maybe 42. Halving the graphics work bought seven frames. Something else was in the way.
Before touching anything I did what I should have done in part one: read the benchmarks. TechSpot measured a desktop RTX 4060 at 61 fps on High at 1080p in a heavy city scene, without any upscaling. GamersNexus got 82 on Ultra in the open field. My card is the laptop version, but the ASUS profile was feeding it 115 W, which is close to the desktop card’s budget. With DLSS on top I should have been comfortably above 60. I was at half of that.
The processor that was running at two thirds
The first thing I checked was the obvious one, because it is cheap: what speed is the CPU actually running at?
$ cat /sys/devices/system/cpu/cpu0/cpufreq/cpuinfo_max_freq
4553983
$ cat /sys/devices/system/cpu/cpu0/cpufreq/scaling_max_freq
3100000
The first number is what the chip can do, 4.55 GHz. The second is what the kernel was allowing it to do, 3.1 GHz, which happens to be this processor’s base clock, the “guaranteed” speed before any boost. All sixteen threads were sitting at exactly 3040 MHz, under load, with the governor set to performance and the laptop on its performance profile. A third of the single core speed was simply gone, and nobody had told me.
Unlocking it is one line as root:
for c in /sys/devices/system/cpu/cpu*/cpufreq/scaling_max_freq; do echo 4553983 > $c; done
The cores jumped to 4.16 GHz. The GPU went from 65% to 90% busy, which is what you want to see: the graphics card was finally being fed. The market street went from 30 to 45 fps.
And then, one minute and forty one seconds later, it went back to 3.1 GHz.
I only know the exact time because I had left a script watching the file. When the value flipped, the script dumped everything that had happened in the previous twenty seconds: nothing. No daemon logged anything, the power profile had not changed, GameMode was still active, the governor was still performance. Something reset the limit silently, and it kept doing it every couple of minutes.
This turned out to be a known bug in amd-pstate, the kernel driver that decides how fast a modern AMD processor runs. Somebody with a Ryzen AI 9 HX 370 reported the identical symptom in July: the driver clamps the maximum frequency to the base clock after certain firmware events, a change of platform profile in his case. The maintainer asked for a reproduction on a vanilla kernel, nobody provided one, and the bug was closed for lack of data on August 3rd. Meanwhile my laptop hit it every few minutes.
What pokes the firmware on my machine, I think, is NVIDIA’s Dynamic Boost. On these gaming laptops the GPU and CPU share a power budget, and a small daemon called nvidia-powerd moves watts from one to the other depending on load. I watched the GPU power limit go from 80 W at boot to 115 W to 140 W during the session. Every one of those moves is the firmware telling the kernel “the CPU’s limit changed”, and every one of them trips the bug. I have not proven that last step, because proving it means turning Dynamic Boost off and losing a third of the GPU’s power budget, and I had already lost enough of the afternoon.
The fix is stupid and it works. A tiny service that wakes up every five seconds, compares the two numbers and rewrites the max when they differ:
while :; do
  for c in /sys/devices/system/cpu/cpu[0-9]*/cpufreq; do
    max=$(cat "$c/cpuinfo_max_freq"); cur=$(cat "$c/scaling_max_freq")
    [ "$cur" != "$max" ] && echo "$max" > "$c/scaling_max_freq"
  done
  sleep 5
done
It logs every correction to the journal, so as a side effect I now have a record of how often the bug fires. Wrapped in a systemd unit, enabled, done. With the clock held up, the market street settled at 46 to 52 fps.
Wrong turns, quickly
Between the first unlock and the second, I chased three things that were not it, and I’ll list them because they are exactly what you will chase too.
NVIDIA Reflex was on. Reflex is a low latency mode that makes the CPU wait for the GPU so your inputs feel snappier, and under Proton it has a reputation for eating frames. I turned it off. Nothing changed.
My own recording tool was telling me the game ran at 60. I record my gameplay with Grifone, which sits on top of gpu-screen-recorder, and its log prints a “damage fps” that I read as “frames the game is presenting”. It is not. It counts how often anything on screen changed, and moving the camera with a mouse counts. It said 60 while MangoHud said 35. MangoHud was right. Lesson: trust the tool that hooks the game, not the tool that watches the screen.
And the laptop was three gigabytes into swap with 500 MB of RAM free, which looked alarming until I measured page faults: zero. Sixteen gigabytes is tight for this game plus a browser, but it was not the problem that afternoon.
The part that actually is Proton
With the CPU sorted, the picture became what I had assumed at the start: GPU at 97%, 79 W, top clock, and 50 fps. The card was working as hard as it could. On Windows the same card does more with the same scene, and the difference is the translation layer.
A short explanation, since part one glossed over it. Crimson Desert talks to the graphics card in Direct3D 12, a Windows API. Linux does not have it, so Proton ships vkd3d-proton, a library that takes every D3D12 call and turns it into the equivalent Vulkan call on the fly. Most of the time this is nearly free. Some of the time a game does something that has no clean Vulkan equivalent and the translation gets expensive.
This is one of those games. The Proton log from part one has 235 thousand copies of one warning in a few minutes of play, “Avoiding split due to long running scoped query”, plus a few hundred of the “NumPlanes == 0” one. I am not going to pretend I understand what they mean in detail. What I do understand is that someone on Valve’s Proton tracker has the exact same warnings on an RTX 5070 Ti with a 9950X3D, a machine several times faster than mine, and reports the GPU never going above 48% busy. It is the game and the translator, and no setting on my side changes it. The vkd3d-proton I transplanted in part one is already the September build with the fixes that mention this game by name. There is nothing newer to try.
That person also mentions something I had to test: with Frame Generation on, their frame rate went from 40 to 180. Frame Generation is the other DLSS trick, the one where the card invents an extra frame between two real ones. It doubles what you see on screen but not what the game simulates, so your inputs still land at the real rate. In their case the real rate went up too, which suggests the feature reshuffles the pipeline in a way that dodges the translation problem. In mine it did not. 60 to 80 on the counter, 30 to 40 underneath, and I could feel the difference in combat.
So the honest ceiling of this laptop, in this city, today, is about 50 real frames. I could get to 60 by rendering at 540p and setting the lighting to Low, and I tried it long enough to know I would rather have 50.
The turbine
Here is what I had not been paying attention to while I was chasing frames. With the CPU finally at full speed, its temperature was at 95°C, which is where this chip starts protecting itself. The GPU was at 85°C. Both fans were at their maximum, 6000 and 6300 RPM, and had been for hours. My other games do not do this. This one turned the laptop into a hair dryer, and it was not even delivering the frames.
The rest of the afternoon was about heat, and every single step had a trap in it.
The CPU’s power limit. The 7435HS was allowed 80 W. The game uses two or three cores for real, and two or three cores do not need 80 W. On ASUS laptops the limit is called PPT and you set it through asusctl. I set it to 55 W. The fps did not change, which was the good news. The temperature did not change either, which was strange, until I read the firmware directly and found it still at 80. asusctl had stored my number in its config and skipped applying it, because a flag called “tuning” was off for the profile. Turning the flag on and reapplying the profile pushed it through, and then a second cut to 45 W brought the CPU down to 77°C with no frame lost. I checked the value in /sys/class/firmware-attributes/asus-armoury/attributes/ppt_pl1_spl/current_value after every change, and I recommend you do too, because the tool will tell you it worked when it did not.
The GPU’s clock. This one I did not expect to matter as much as it did. The card was boosting to 2625 MHz to render a game capped at 60 fps, with Frame Generation on, which means it only needed to produce 30 real frames. A chip at its top clock needs a lot of voltage for the last few hundred megahertz. Cap the clock, and the same frames come out at a fraction of the power:
sudo nvidia-smi -lgc 0,2100
GPU power went from 60 to 44 W. Temperature went from 68 to 63°C. Frame rate: identical, still pinned at 60. It is the cheapest fifteen watts I have ever saved. I wrapped it in a small script that locks the clock when the game starts and releases it when the game exits, so the rest of my games keep the full boost.
The fans. This is where the plan was supposed to be simple: pick a healthy temperature ceiling (83°C for the GPU, 88°C for the CPU) and lower the fan curve until the chips sit just under it. asusctl lets you write a custom curve per profile. Three traps, one after the other.
First, every time you write a new curve, asusctl saves it disabled. You have to enable it again after every edit, or the firmware quietly goes back to its own curve while you sit there wondering why nothing changed.
Second, the percentages lie. I wrote “15%” and watched the fan run at what was clearly 40%. The tool converts a percentage into a 0 to 255 value for the kernel, and on this kernel the firmware reads that value as a percentage again, so 15% became 38 out of 255 became 38%. The fix is to write raw numbers that already equal the percentage you want, with no percent sign:
asusctl fan-curve --mod-profile Balanced --fan gpu --data "40c:10,65c:18,72c:30,77c:45,81c:60,84c:80,86c:100,88c:100"
asusctl fan-curve --mod-profile Balanced --fan cpu --data "50c:10,78c:20,83c:30,87c:40,90c:55,92c:70,94c:85,96c:100"
asusctl fan-curve --mod-profile Balanced --enable-fan-curves true
Third, the performance profile has a floor. Whatever curve I wrote, the CPU fan would not go below 4700 RPM while the laptop was in Performance mode. The firmware’s embedded controller enforces a minimum per profile and does not care what you ask for. Switching to the Balanced profile dropped the floor to about 3300, and with the custom curves on top of it the fans settled at 3300 and 2900 RPM. I kept the same 45 W limit and the same clock lock on Balanced, so the game did not notice the change at all. Performance mode, it turns out, just lets the whole machine off the leash, and this game only ever needed part of it.
Wow, the difference. From a turbine to the sound of a laptop running a game, which is what it is.
The numbers, before and after, same street, same game:
| Start of the afternoon | End of the afternoon | |
|---|---|---|
| Frame rate in the city | 30 to 35 | 60 on screen, about 50 real without Frame Generation |
| CPU clock | 3.04 GHz, stuck | up to 4.3 GHz when it needs it |
| CPU temperature | 95°C | 77 to 87°C |
| GPU power and temperature | 79 W, 85°C | 41 to 51 W, 65 to 73°C |
| Fans (CPU / GPU) | 6000 / 6300 RPM | 3300 / 2900 RPM |
The recipe
If your Crimson Desert runs but stutters on an AMD laptop with an NVIDIA card, and the fans are screaming, in this order:
- Check the CPU before anything else. If
scaling_max_freqis lower thancpuinfo_max_freq, you have the amd-pstate bug and no graphics setting will help. Unlock it, watch whether it comes back, and if it does, run the five second loop above as a service. - Trust MangoHud for the frame rate. Not your recorder, not your eyes.
- Do not bother with Reflex or with Frame Generation as a fix for a low frame rate. On this game under vkd3d-proton the ceiling is the translation layer. Frame Generation is fine for smoothness once the real rate is above 45 or so, and the cap must be raised above 60 in MangoHud or it halves your real frames.
- Cap the game at 60 and lock the GPU clock around 2100 MHz with
nvidia-smi -lgc. Same frames, far less heat. Release it withnvidia-smi -rgc. - Lower the CPU power limit to 45 W through asusctl, enable tuning for the profile, reapply the profile, and read the value back from
/sys/class/firmware-attributes/asus-armoury/. - Write the fan curves in raw numbers, enable them after every write, and use the Balanced profile, because Performance has a fan floor you cannot go under.
- Play. My settings, for the record: the High preset with Lighting and Model on Medium, DLSS 4.0 on Balanced, Frame Generation 2x, capped at 60. That is 60 on the counter and 50 underneath, which is where this laptop honestly is.
One more caveat. The laptop is from 2023 and the GPU was hitting 85°C at 79 W with the fans maxed, which is not how a healthy 4060 behaves. New thermal paste is scheduled for next week. Everything above stands on its own, but I expect the fan curves to have another notch to give after that.
What I take from this
The thing I suspected at the start, Proton, was real, and it was the smallest of the three problems. The biggest one was a CPU running at two thirds of its speed because of a kernel bug that nobody reproduced, triggered by a power daemon doing its job. The second was a laptop that had never once run at full speed under Linux, and so had never shown me what full speed does to its cooling. I have no idea for how long I had been playing on a throttled machine and calling it “fine”.
The other thing is smaller and I keep learning it. Every tool I used lied to me at least once that afternoon: the recorder about the frame rate, asusctl about the power limit, the fan curve about its own percentages. The only thing that never lied was the file in /sys that the firmware reads. When the tool says it worked, go read the file.
Anyway. The game runs at 60, the laptop is quiet, and this time I actually played it, for a good deal longer than a minute.
Apparently this “Getting [insert game title] to Run on Arch Linux” thing really is turning into a series, because the same game gave me two posts in two days. The next one, if there is one, will be about thermal paste, and I would rather it be about the game.